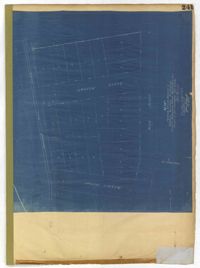
Page 241 of the City Engineer's Plat Book with one plat. The plat shows lots on and near King Street, Baxter Street, and Lenox Street. It also shows the end of Sans Souci Street.
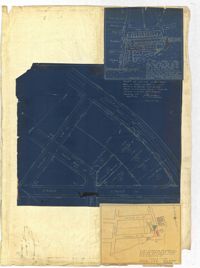
Page 259 of the City Engineer's Plat Book with three plats. Plat 1 shows lots located between Hester Street and Piedmont Street. Plat 1 also shows Alberta Street, Poplar Street, and a stretch of marsh land. Plat 2 shows lots located between Tradd Street, Ashley Street, and Murray Boulevard. Plat 2 also shows South Bay Street. Plat 3 shows a city block between Hester Street and Piedmont Avenue, and between Poplar Street and Alberta Avenue.
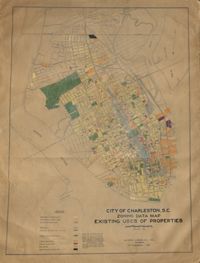
Hand-colored, linen map showing Charleston peninsula existing lot uses from Murray Boulevard to the northern limits of the city at Mount Pleasant Road. Map shows one, two, and multiple dwelling units, service stations, garages, industrial sites, and railroads. Information on map was compiled during field observations made from October through December 1930. Map measures 46.25" by 63."
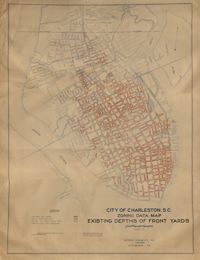
Hand-colored, linen map showing Charleston peninsula existing depths of front yards (5 feet and under, 6 to 14 feet, 15 to 24 feet, 25 feet and over). Map reflects Murray Boulevard to the northern limits of the city at Mount Pleasant Road. Map measures 47" by 63".
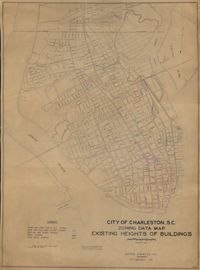
Hand-colored, linen map showing Charleston peninsula heights of buildings from Murray Boulevard to the northern limits of the city at Mount Pleasant Road. Height in stories is indicated by color coding. Map shows buildings of three stories or more. Map measures 42" by 60".
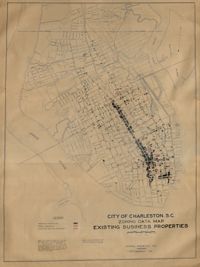
Hand-colored, linen map showing Charleston peninsula existing business properties, public garages, and gasoline service stations from Murray Boulevard to the northern limits of the city at Mount Pleasant Road. Map measures 46.75" by 63".
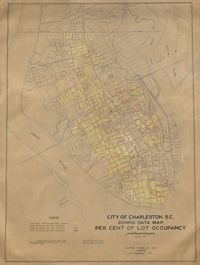
Hand-colored, linen map showing Charleston peninsula lot occupancy from Murray Boulevard to the northern limits of the city at Mount Pleasant Road. Map is color coded to show lot occupancy percentages on the peninsula. Map measures 46.5" x 63".
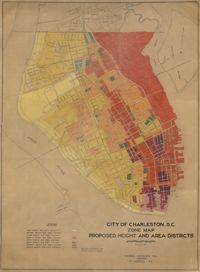
Hand-colored, linen map showing proposed height and area districts for the city of Charleston. Map shows eight height and area districts from Murray Boulevard to the northern limits of the city at Mount Pleasant Road. Map measures 42" by 60".
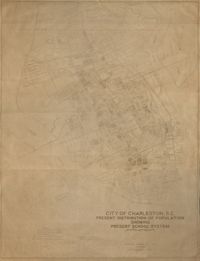
Linen map showing distribution of schools in Charleston from Murray Boulevard to the northern limits of the city at Mount Pleasant Road. Map shows school district lines, developed and undeveloped school properties and racial population disbursement indicated by white circles for white residents and black circles for black residents. Map is found on page 11 of the Report of the City Planning and Zoning Commission. Map measures 41.25" by 59".
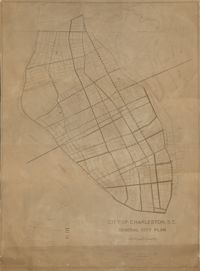
Linen map showing existing and proposed parks; thoroughfares; schools; residential, business, and industrial districts; and suggested streets from Murray Boulevard to the northern limits of the city at Mount Pleasant Road. Residential districts are identified by racial makeup and labeled as white residence and colored residence districts. Map is found on page 11 of the Report of the City Planning and Zoning Commission. Map measure 41" by 59".